Getting Started
AethOS is a cross-cloud and edge orchestration console — one management surface for machines that span public clouds, private bare metal, and edge sites. This page walks you through signing in, choosing a tenant, and finding your way around the workbench.
Sign in
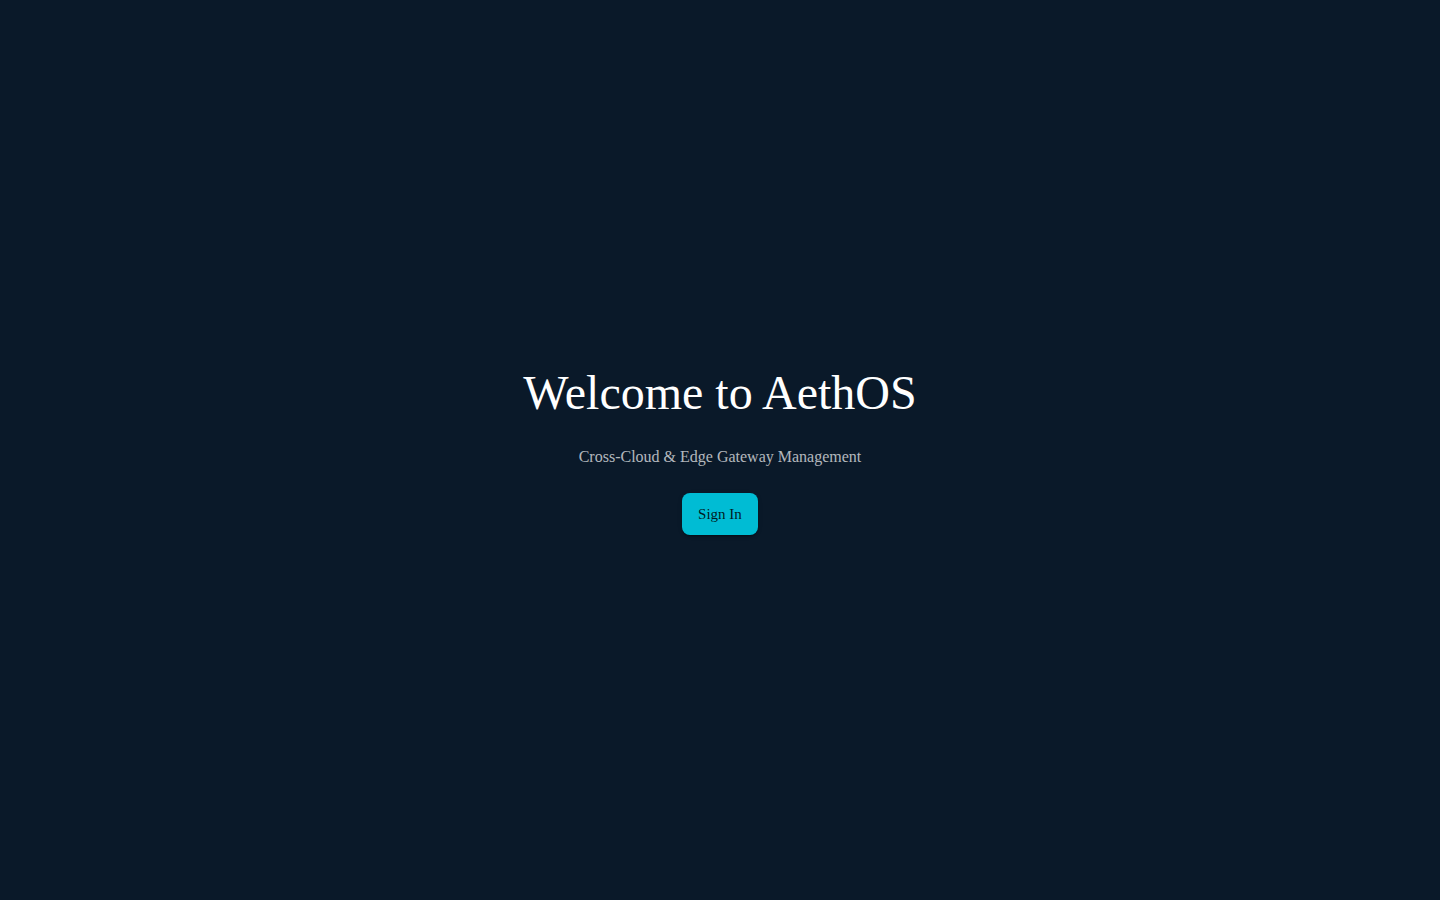
- Open AethOS. The landing page reads “Welcome to AethOS” with the tagline Cross-Cloud & Edge Gateway Management.
- Click Sign In.
- Complete sign-in with the Nandeshou identity service (OpenID Connect). Accounts, passwords, and multi-factor are managed through Kanshin — AethOS itself doesn’t have a separate password screen.
Once you’re authenticated, AethOS takes you into the app.
Pick a tenant
AethOS is multi-tenant. A tenant is an isolated space that owns its own directory, infrastructure, deployments, and policies — one tenant can never see or change another’s data.
If your account belongs to more than one tenant, AethOS shows a tenant selection screen after sign-in. Choose the tenant you want to work in; everything you then see and do is scoped to it.
Switch tenants without signing out
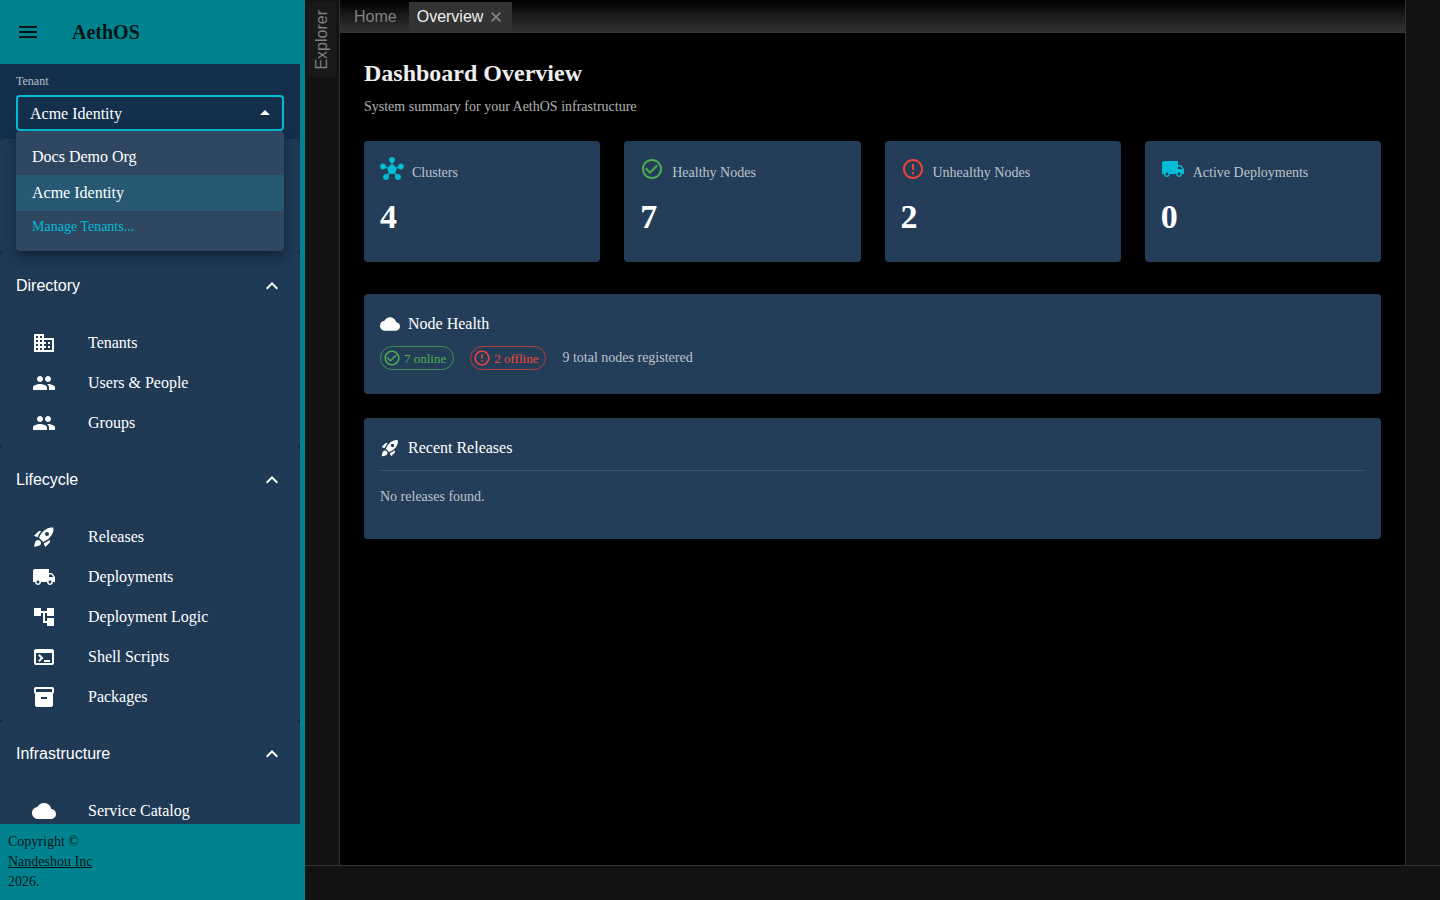
Once you’re in the console, a Tenant switcher sits at the top of the left sidebar, just under the AethOS heading. It’s a dropdown labelled Tenant:
- Open the dropdown to see every tenant you’re a member of, listed by name.
- Pick a different one to switch the whole console to it immediately — the sidebar, dashboard, and every list re-scope to that tenant. There’s no need to sign out.
- The last entry, Manage Tenants…, takes you back to the full tenant picker (the same screen you saw after sign-in).
The workbench
AethOS opens on a workbench: an expanded sidebar on the left titled AethOS, and a work area on the right that starts on a Home tab.
- The left sidebar is a set of collapsible groups, all expanded when you arrive. Click a group heading to collapse or re-expand it; click an item to open it.
- Click the menu (☰) button at the top of the sidebar to collapse it to icons only, and again to expand it. You can also drag the sidebar’s right edge to resize it.
- Directly beneath the AethOS heading is the Tenant switcher (see Switch tenants without signing out above).
- The work area is a tabbed space. Each list, editor, or viewer you open becomes its own tab you can close, so you can keep several things open side by side.
The Dashboard overview
The Home tab (also reachable from Dashboard → Overview) is your Dashboard Overview, subtitled “System summary for your AethOS infrastructure.” You’ll see:
- Summary cards for Clusters, Healthy Nodes, Unhealthy Nodes, and Active Deployments.
- A Node Health panel showing how many nodes are online versus offline, and the total registered.
- A Recent Releases list with each release’s name, version, and status.
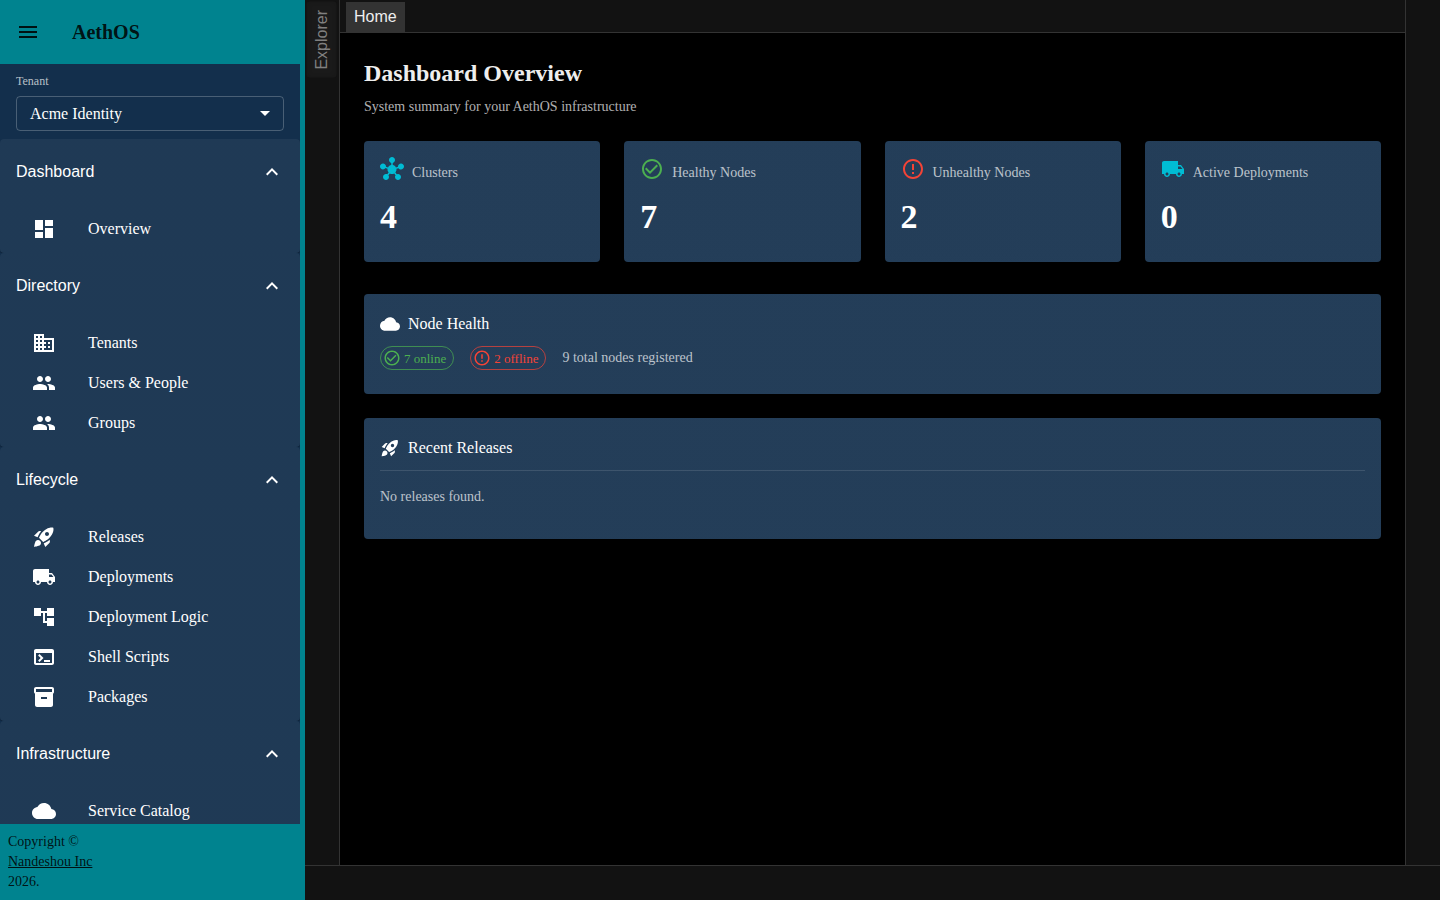
If the tenant is brand new, the counts read zero and Recent Releases shows “No releases found” — that’s expected until you start registering infrastructure and creating releases.
A tour of the navigation
The sidebar groups the console into these areas. Everything is scoped to your current tenant.
| Group | Where you go | What you do there |
|---|---|---|
| Dashboard | Overview | See the estate summary (clusters, node health, active deployments, recent releases) |
| Directory | Tenants, Users & People, Groups | Manage tenants and the people in them |
| Lifecycle | Releases, Deployments, Deployment Logic, Shell Scripts, Packages | Define what runs and roll it out |
| Infrastructure | Service Catalog, Clusters, Nodes, Workspaces | Register the compute and the software AethOS manages |
| Security | Roles, Members, Vault Policies, Identities (AppRoles), SSH Keys | Govern access to the tenant and its secrets |
| Observability | Live Bus, Audit Log | Watch the message bus and review the audit trail |
| Profile | My Profile, Logout | View your profile, or sign out |
Sign out
Open the Profile group at the bottom of the sidebar and click Logout.
Good to know
- The console is a tabbed workbench, not a page-per-screen web app. Sidebar items open tabs in the work area rather than navigating to a new URL, so use the tabs (not the browser back button) to move between what you’ve opened.
- The Dashboard, node counts, and cluster statistics are read from the AethOS server. Some backend pieces are still early, so a fresh environment may show zeros or placeholder values until real nodes check in.
Related pages
- The Directory — tenants, people, and groups
- Infrastructure — clusters, nodes, workspaces, and the service catalog
- Deployments — the lifecycle from logic to a running deployment