Infrastructure
The Infrastructure group in the sidebar is where you register the compute AethOS manages and the software it can place on it. You’ll find four items under Infrastructure: Service Catalog, Clusters, Nodes, and Workspaces.
The service catalog
The service catalog is your inventory of installable software templates — the things AethOS knows how to deploy.
- Open Infrastructure → Service Catalog. A Service Catalog tab opens.
- The table shows each template’s Name, Category (a chip), Description, Docs URL, Enabled (a Yes/No chip), and Created.
- Click New to add a template, or select one and click Edit (or double-click it) to change it. Select and click Delete to remove one.
A template carries a name, a category, a documentation URL, a default configuration, and an enabled flag.
Manage clusters
A cluster groups machines into one logical unit you manage together, across any provider.
- Open Infrastructure → Clusters. A Clusters tab opens.
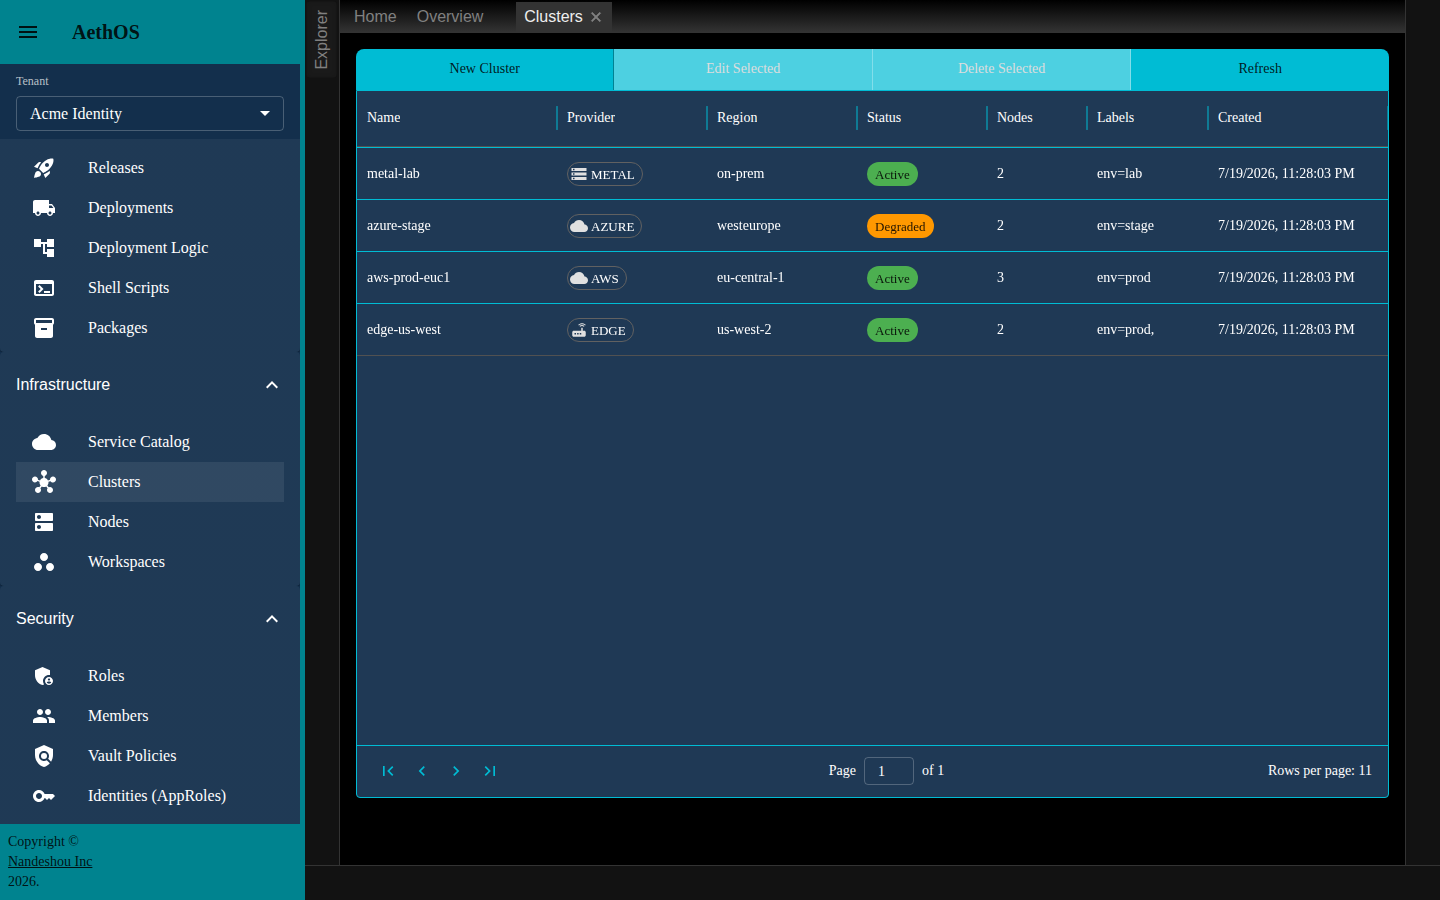
- The table shows Name, Provider (an icon-and-label chip — AWS, GCP, AZURE, METAL, or EDGE), Region, Status (Active, Degraded, Offline, or Provisioning), Nodes, Labels, and Created.
- Click New Cluster to add one, or select a row and click Edit Selected (or double-click it) to open it. Delete Selected asks you to confirm before removing a cluster. Refresh reloads the list.
Create a cluster
New Cluster opens a cluster editor on its Details tab with a form:
- Enter a Name and a Slug (a URL-friendly identifier such as
my-cluster) — both are required. - Add a Description.
- Pick a Provider — AWS, GCP, Azure, Metal, or Edge.
- Set the Region and the Status (Active, Degraded, Offline, or Provisioning).
- Optionally add Labels as key/value pairs — type a key and value and click the + button; each label appears as a removable chip.
- Click Create Cluster.
Work with an existing cluster
Opening a saved cluster gives you three tabs:
- Details — edit fields inline (click the pencil next to Name, Slug, Description, or Region), change Provider/Status, manage Labels, and click Save Changes. Below the fields you’ll see Cluster Statistics cards (Total CPU Cores, Total RAM, Total Disk Free, Online / Total Nodes, Offline Nodes) and a Topology Map — a live graph drawn from the cluster’s node announcements, with pan, zoom, and fit controls.
- Nodes — the machines in this cluster (see below).
- Control — the cluster’s control planes (see below).
View a cluster’s nodes (the in-cluster Nodes tab)
A node is a single managed machine — a cloud instance, a bare-metal server, or an edge gateway. Every node belongs to a cluster. To see just the nodes in one cluster, open that cluster and click its Nodes tab.
You’ll see a table of Hostname, Node ID (NATS), Status (Online, Draining, Cordoned, or Offline), Role (Leader, Council, or Follower), CPU Cores, Memory (MB), and Last Seen. Double-click a node to open its detail view, or click Refresh to reload.
This in-cluster tab and the top-level Nodes list (below) show different columns: the cluster tab emphasises capacity and orchestration Role, while the top-level list emphasises identity and Labels.
Control a cluster (the Control tab)
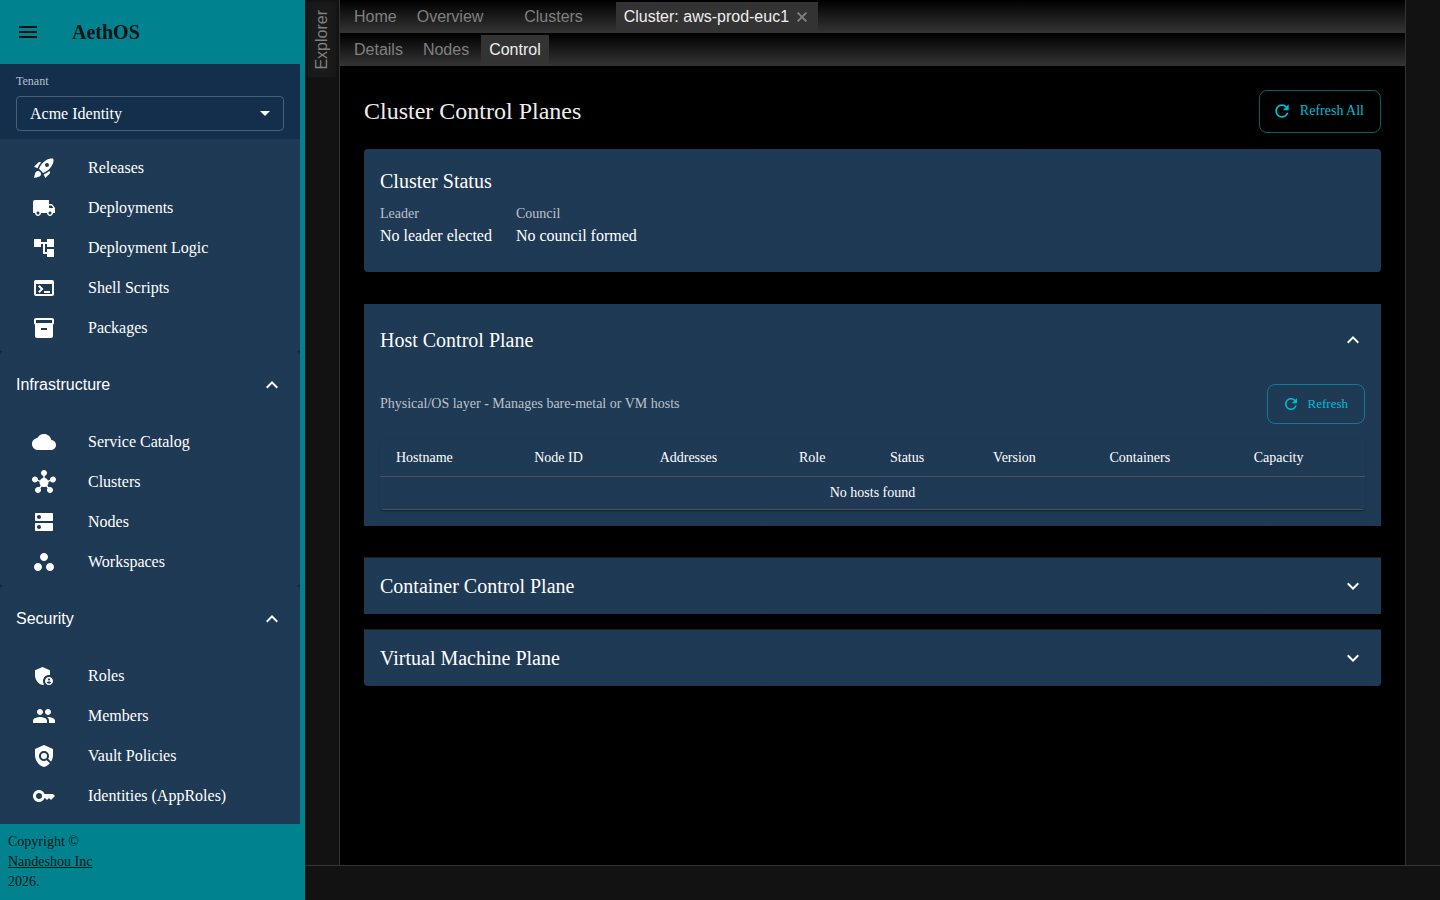
The Control tab — headed Cluster Control Planes — is the operational view of a cluster. It has a Cluster Status card at the top and three accordions below it:
- Cluster Status shows the current Leader and Council, derived live from the nodes that have checked in. Before any node reports in you’ll see “No leader elected” and “No council formed”; once a leader is elected its node ID appears with a Term, and once a council forms its ID appears with a member Size.
- Host Control Plane (an accordion, open by default) — the physical/OS layer. It lists the hosts (Hostname, Node ID, Addresses, Role, Status, Version, Containers, Capacity), with its own Refresh.
- Container Control Plane (an accordion) — the application layer. Each container row (Container ID, Host, Actions) carries per-row actions: Health (shows live metrics — status, response time, error rate, CPU, memory, requests/sec), Signal (send SIGTERM, SIGKILL, or RELOAD with an optional reason), and Config (inject key/value configuration into the container).
- Virtual Machine Plane (an accordion) — expand it and AethOS tells you plainly that this plane isn’t built yet: “Virtual machine management isn’t available for this cluster. The control plane currently orchestrates containers only; a hypervisor plane (provision, migrate, snapshot, terminate) is planned to reuse the same warrant/executor pattern.” There are no VM actions here today.
- Refresh All at the top reloads hosts, containers, leader, and council together.
Browse every node
Nodes is a top-level list of every managed machine across all of the tenant’s clusters, so you don’t have to open each cluster to find one.
- Open Infrastructure → Nodes. A Nodes tab opens.
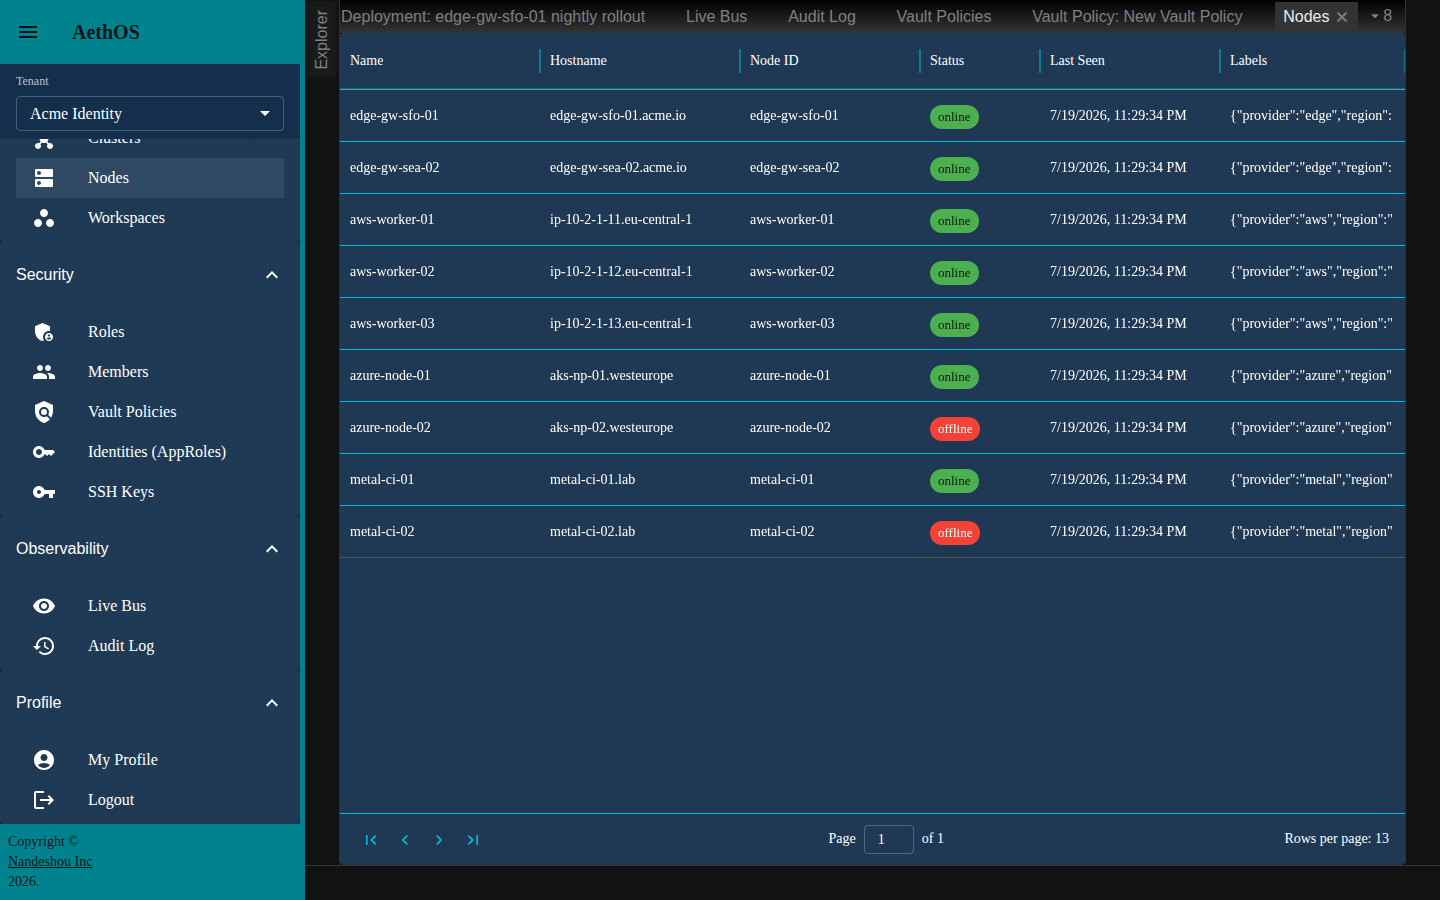
- The table shows Name, Hostname, Node ID, Status (a chip — online green, offline red, draining amber, cordoned grey), Last Seen (a local timestamp), and Labels.
- Double-click a node to open its detail view in a new tab. The detail shows the node’s name and status, its Node ID, Hostname, and Last Seen, a Labels card (each label as a chip, when the node reports any), and a Metadata card that pretty-prints the node’s metadata JSON (when present).
Manage workspaces
Workspaces are disposable container environments — handy for a throwaway shell or a build box that AethOS can reach over SSH.
- Open Infrastructure → Workspaces. A Workspaces tab opens.
- The table shows Name, Image, Status (a chip — Running is green, Stopped grey, Error red, transitional states amber/blue), SSH Host:Port, and an Actions column.
- Click New Workspace to create one (it starts from an image such as
ubuntu:22.04), or select a row and click Edit Selected. Refresh reloads the list. - In the Actions column, use the ▶ Start, ⏹ Stop, and 🗑 Destroy icons. Each is enabled only when the workspace’s status allows it — you can start a stopped workspace, stop a running one, and destroy a stopped or errored one. Destroying asks you to confirm first.
Once a workspace is running, its SSH Host:Port tells you where to connect.
Good to know
- There are two ways to reach a node. The top-level Nodes list shows every machine in the tenant; a cluster’s own Nodes tab shows just that cluster’s machines (with capacity and orchestration Role columns). Both open the same node detail on a double-click.
- Releases and packages live under Lifecycle, not here. The service catalog holds installable templates; versioned software you roll out — Releases and Packages — is on the Deployments page.
- Leader, Council, and the Topology Map are real, not placeholders. They’re derived from the node announcements the cluster’s machines broadcast, so they stay empty (“No leader elected”, “No council formed”, an empty graph) only until nodes actually check in.
- The Virtual Machine Plane is genuinely not available yet. The control plane orchestrates containers today; the VM plane on a cluster’s Control tab is an explicit placeholder for planned hypervisor support (provision, migrate, snapshot, terminate) and offers no actions.
Related pages
- Deployments — deployment logic, releases, and packages you roll onto this infrastructure
- The Directory — the tenant that owns this infrastructure
- Observability — watching nodes and the message bus in real time