Observability
The Observability group in the sidebar gives you a real-time window into the messaging that drives your tenant and a durable record of every consequential action. You’ll find two items under Observability: Live Bus and Audit Log.
Watch the live message bus
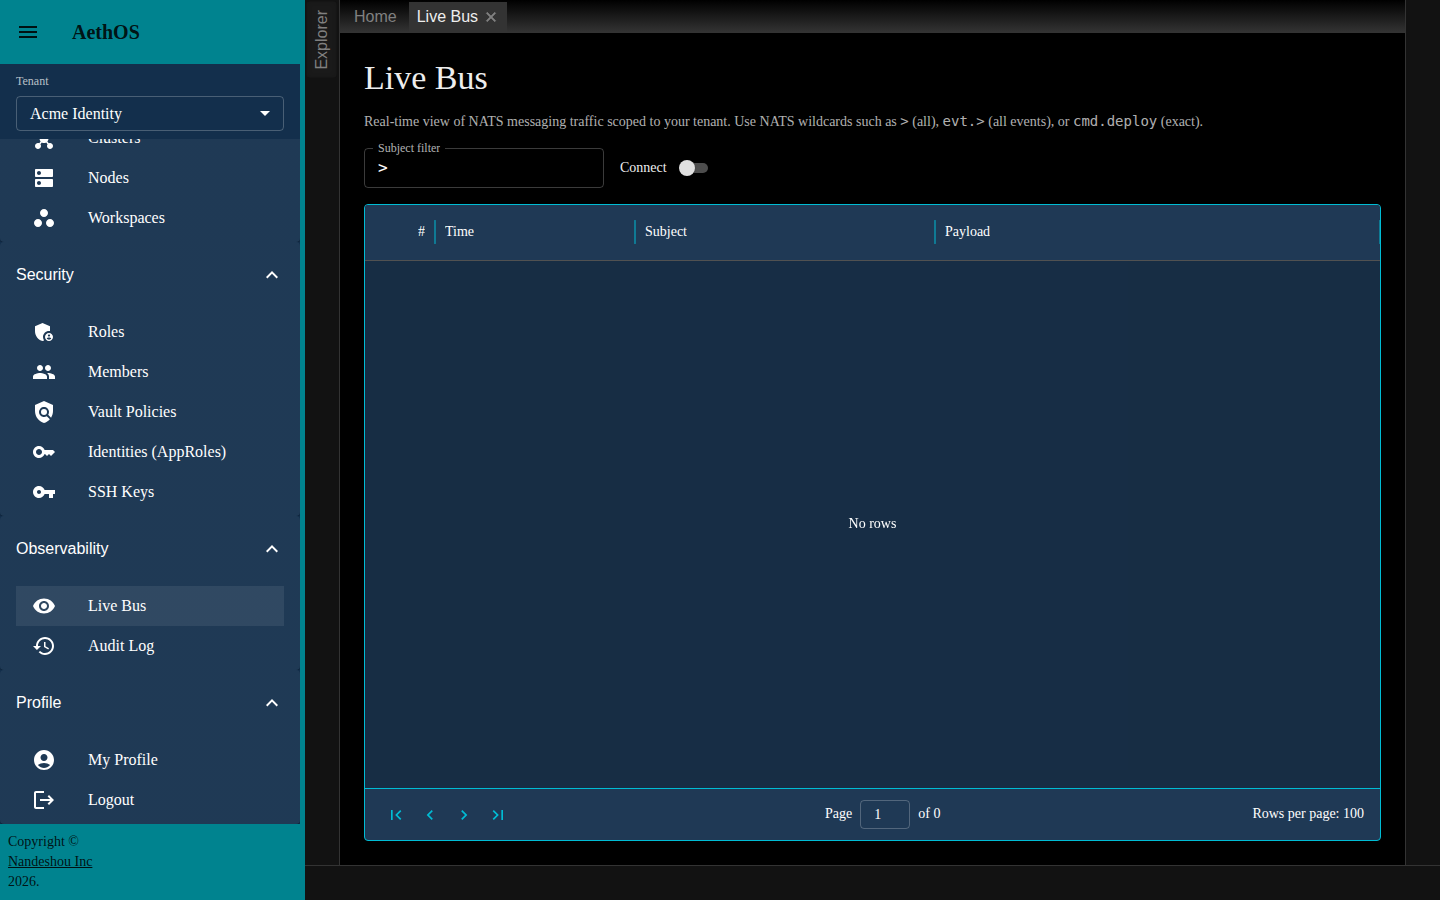
AethOS coordinates nodes and deployments over a NATS message bus. The Live Bus view lets you watch that traffic as it happens, scoped to your tenant.
- Open Observability → Live Bus. A Live Bus tab opens.
- In Subject filter, enter a NATS subject pattern. The default
>matches everything; use wildcards likeevt.>for all events, or an exact subject likecmd.deploy. - Turn the Connect switch on to start streaming. Messages arrive newest-first in the grid, showing #, Time, Subject (as a chip), and Payload.
- Click the expand icon on any row to pretty-print its JSON Payload.
While connected you can:
- Click Pause to freeze the view without dropping the connection, then Resume.
- Change the Subject filter and click Reconnect with new filter to re-subscribe.
- Watch the message-count chip to see how many messages have arrived.
Turn Connect off to stop streaming. Use the live bus to confirm a deployment is progressing, see a node check in, or catch a stall while it’s happening.
Query and tail the audit log
The audit log is the durable record of what happened in your tenant — which actors did what, and when.
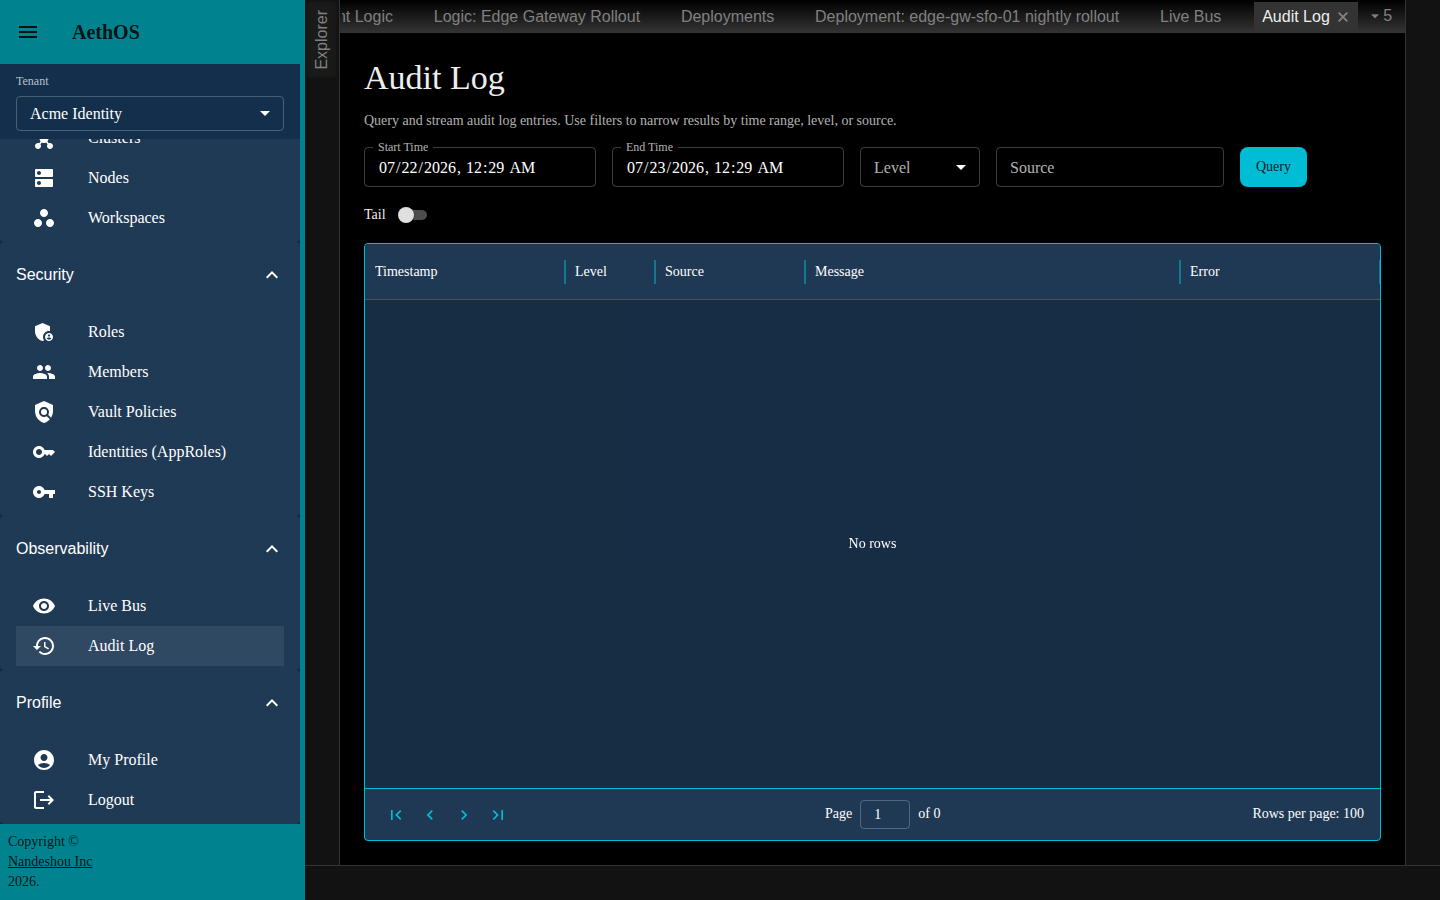
- Open Observability → Audit Log. An Audit Log tab opens.
- Set your filters: a Start Time and End Time, a Level (All, DEBUG, INFO, WARN, or ERROR), and an optional Source.
- Click Query to load matching entries. The grid shows Timestamp, Level (a colour-coded chip), Source, Message, and Error.
To follow the log as new entries arrive, turn the Tail switch on — AethOS streams entries live, and you can Pause and Resume the stream. Turn Tail off to go back to querying a fixed range.
If your Start Time is more than 30 days ago, AethOS warns you that the query may take longer because older entries are retrieved from cold storage.
Good to know
- Both views are tenant-scoped. The live bus only shows subjects for your current tenant, and the audit log only shows your tenant’s actions — you can’t observe another tenant’s traffic.
- Live Bus is a stream, not a store. It shows traffic from the moment you connect onward and keeps a bounded window of recent messages in the view; for a durable record of actions, use the audit log.
Related pages
- The Directory — the people the audit log names as actors
- Security — the machine identities and policies whose use is audited here
- Deployments — the per-run logs for a single deployment